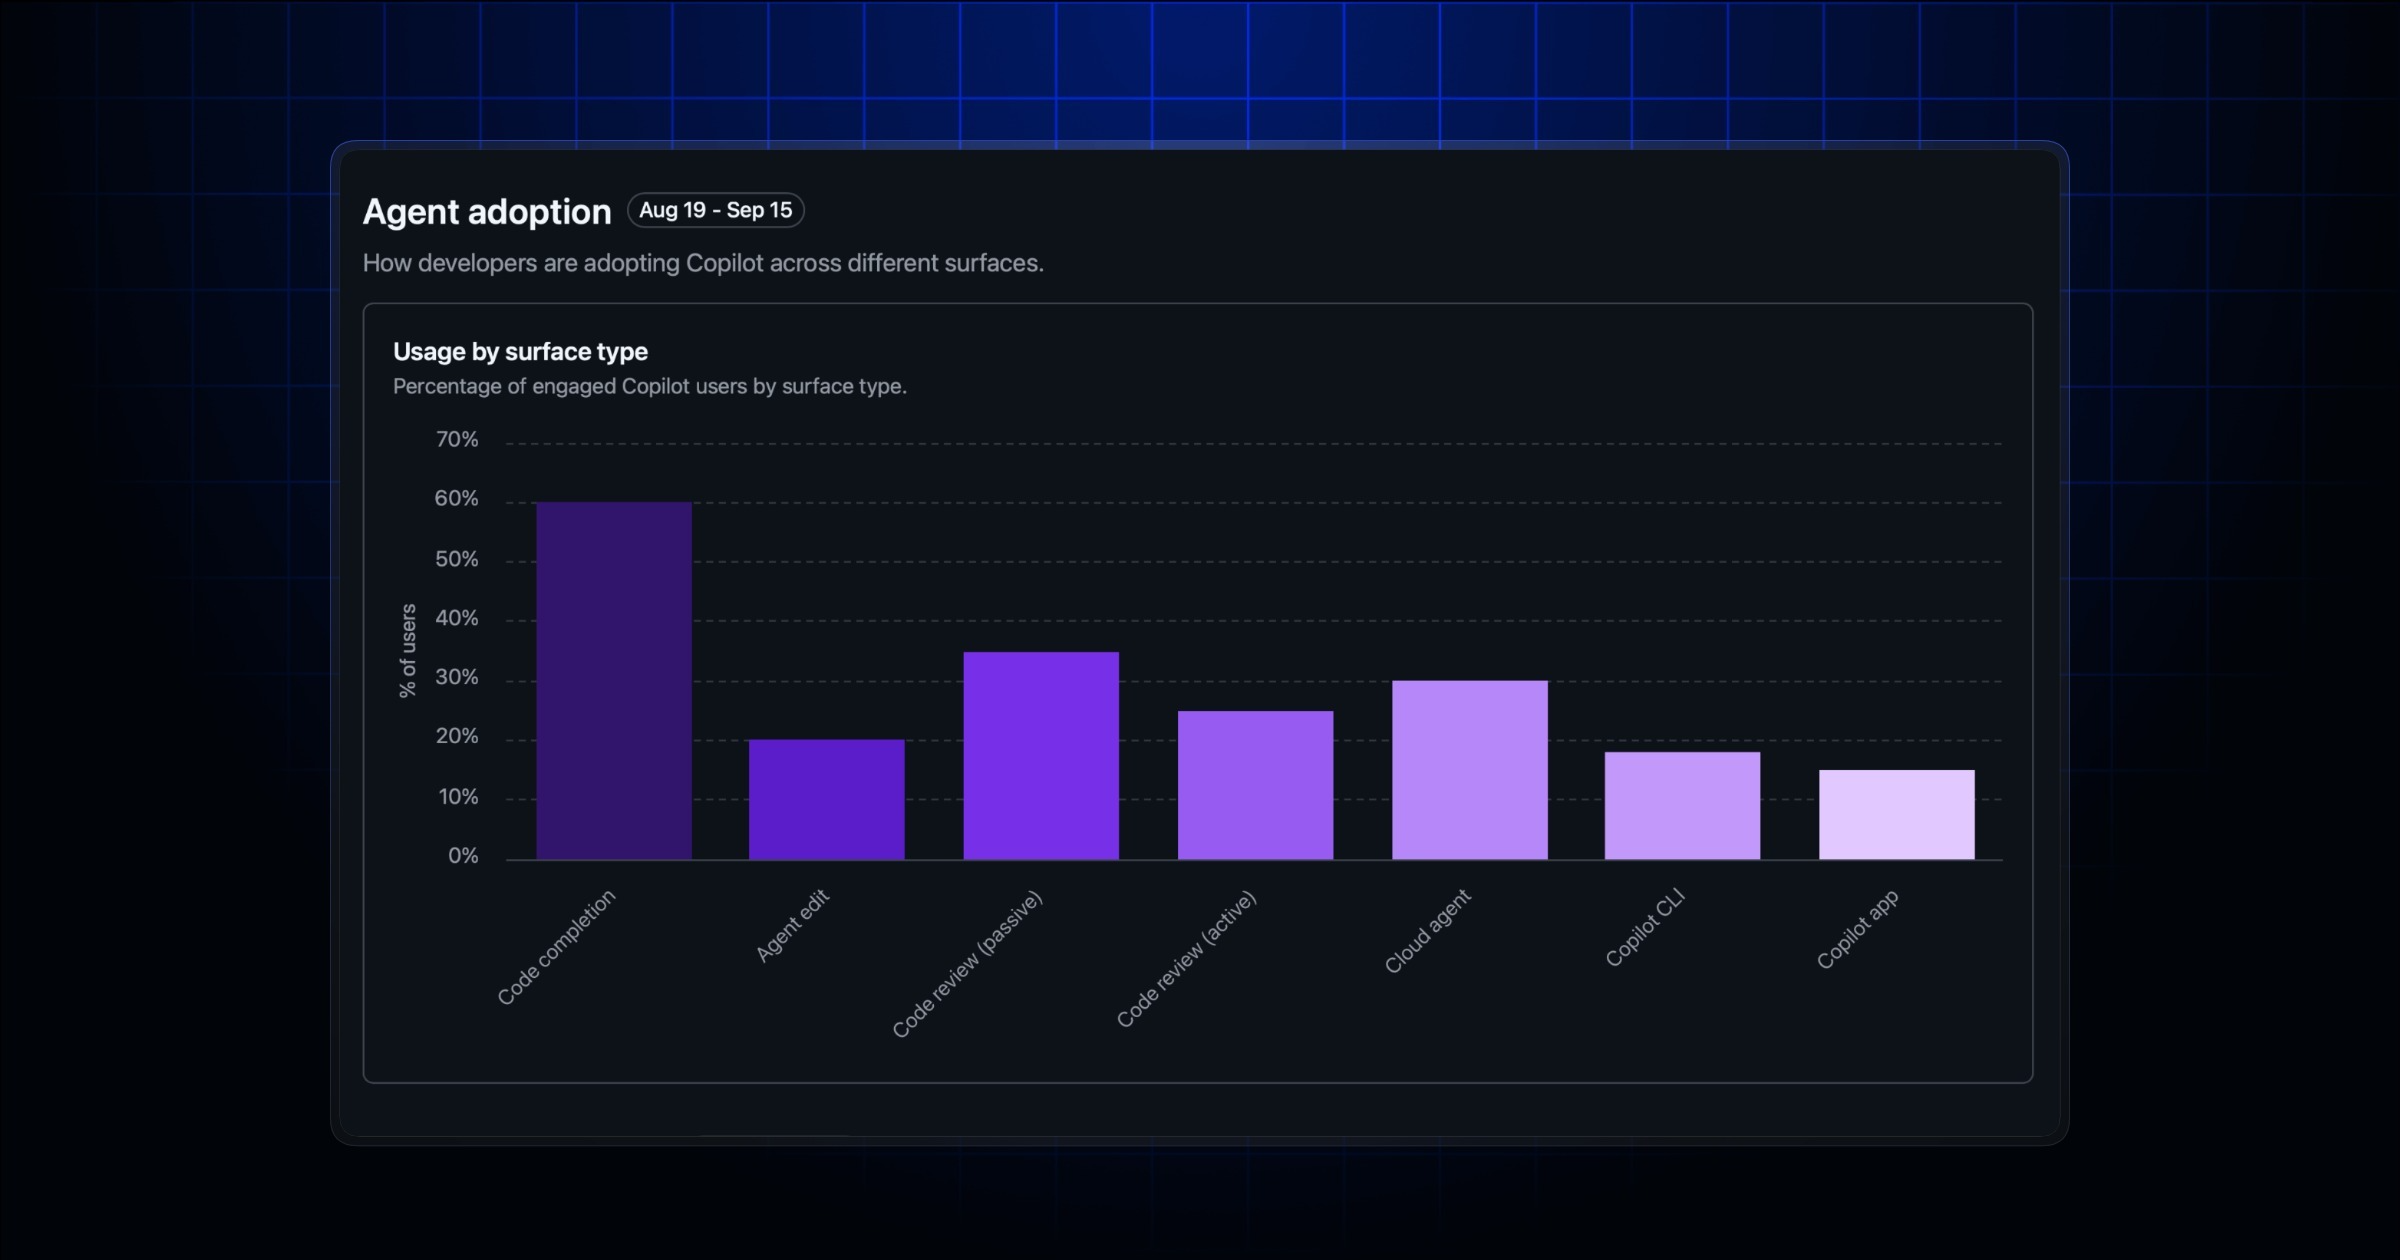
The GitHub Changelog announced that the Copilot impact dashboard now displays metrics on how many active users regularly engage with specific Copilot features. This update allows enterprise administrators to identify widely adopted experiences and areas that may require additional enablement.
Key Points
- The Copilot impact dashboard now shows active user engagement with key Copilot features.
- Enterprise and organization report APIs now include a 28-day feature engagement breakdown.
- AI adoption phase reporting has been improved to include each phase's full rolling 28-day population as of each report day.
- The
copilot_feature_engagementobject adds active-user totals and feature engagement counts to enterprise and organization 28-day aggregate reports. - Engagement is broken down by
code completion,agent edit,passive Copilot code review,active Copilot code review,Copilot cloud agent,Copilot CLI, andCopilot app. users_in_phase_28dreports the full rolling 28-day population classified into each AI adoption phase.- Feature engagement data is available in enterprise and organization 28-day aggregate reports, not user-level reports.
Context
According to the GitHub Changelog, enterprise leaders can use these new metrics to understand which Copilot features are integrating into developers' regular workflows. This insight can help focus training efforts or configuration changes in areas where adoption is lower. Previously, AI adoption phase breakdowns only indicated the number of users active on a given day within each phase; now, they also include the full rolling 28-day phase population for that day.
Why It Matters
This update provides enterprise administrators and leaders with more granular data to assess the utility and adoption of Copilot within their organizations. The enhanced reporting can inform strategic decisions regarding developer tooling, training programs, and resource allocation, directly impacting how Copilot is integrated and utilized across development teams.
What To Do
- Visit the Copilot usage metrics API documentation to explore the new reporting capabilities.
- Note that feature engagement is available in enterprise and organization 28-day aggregate reports.
- Confirm that the Copilot usage metrics policy is enabled to access this data.
- Review the
totals_by_featurebreakdown to understand engagement across different Copilot functionalities.