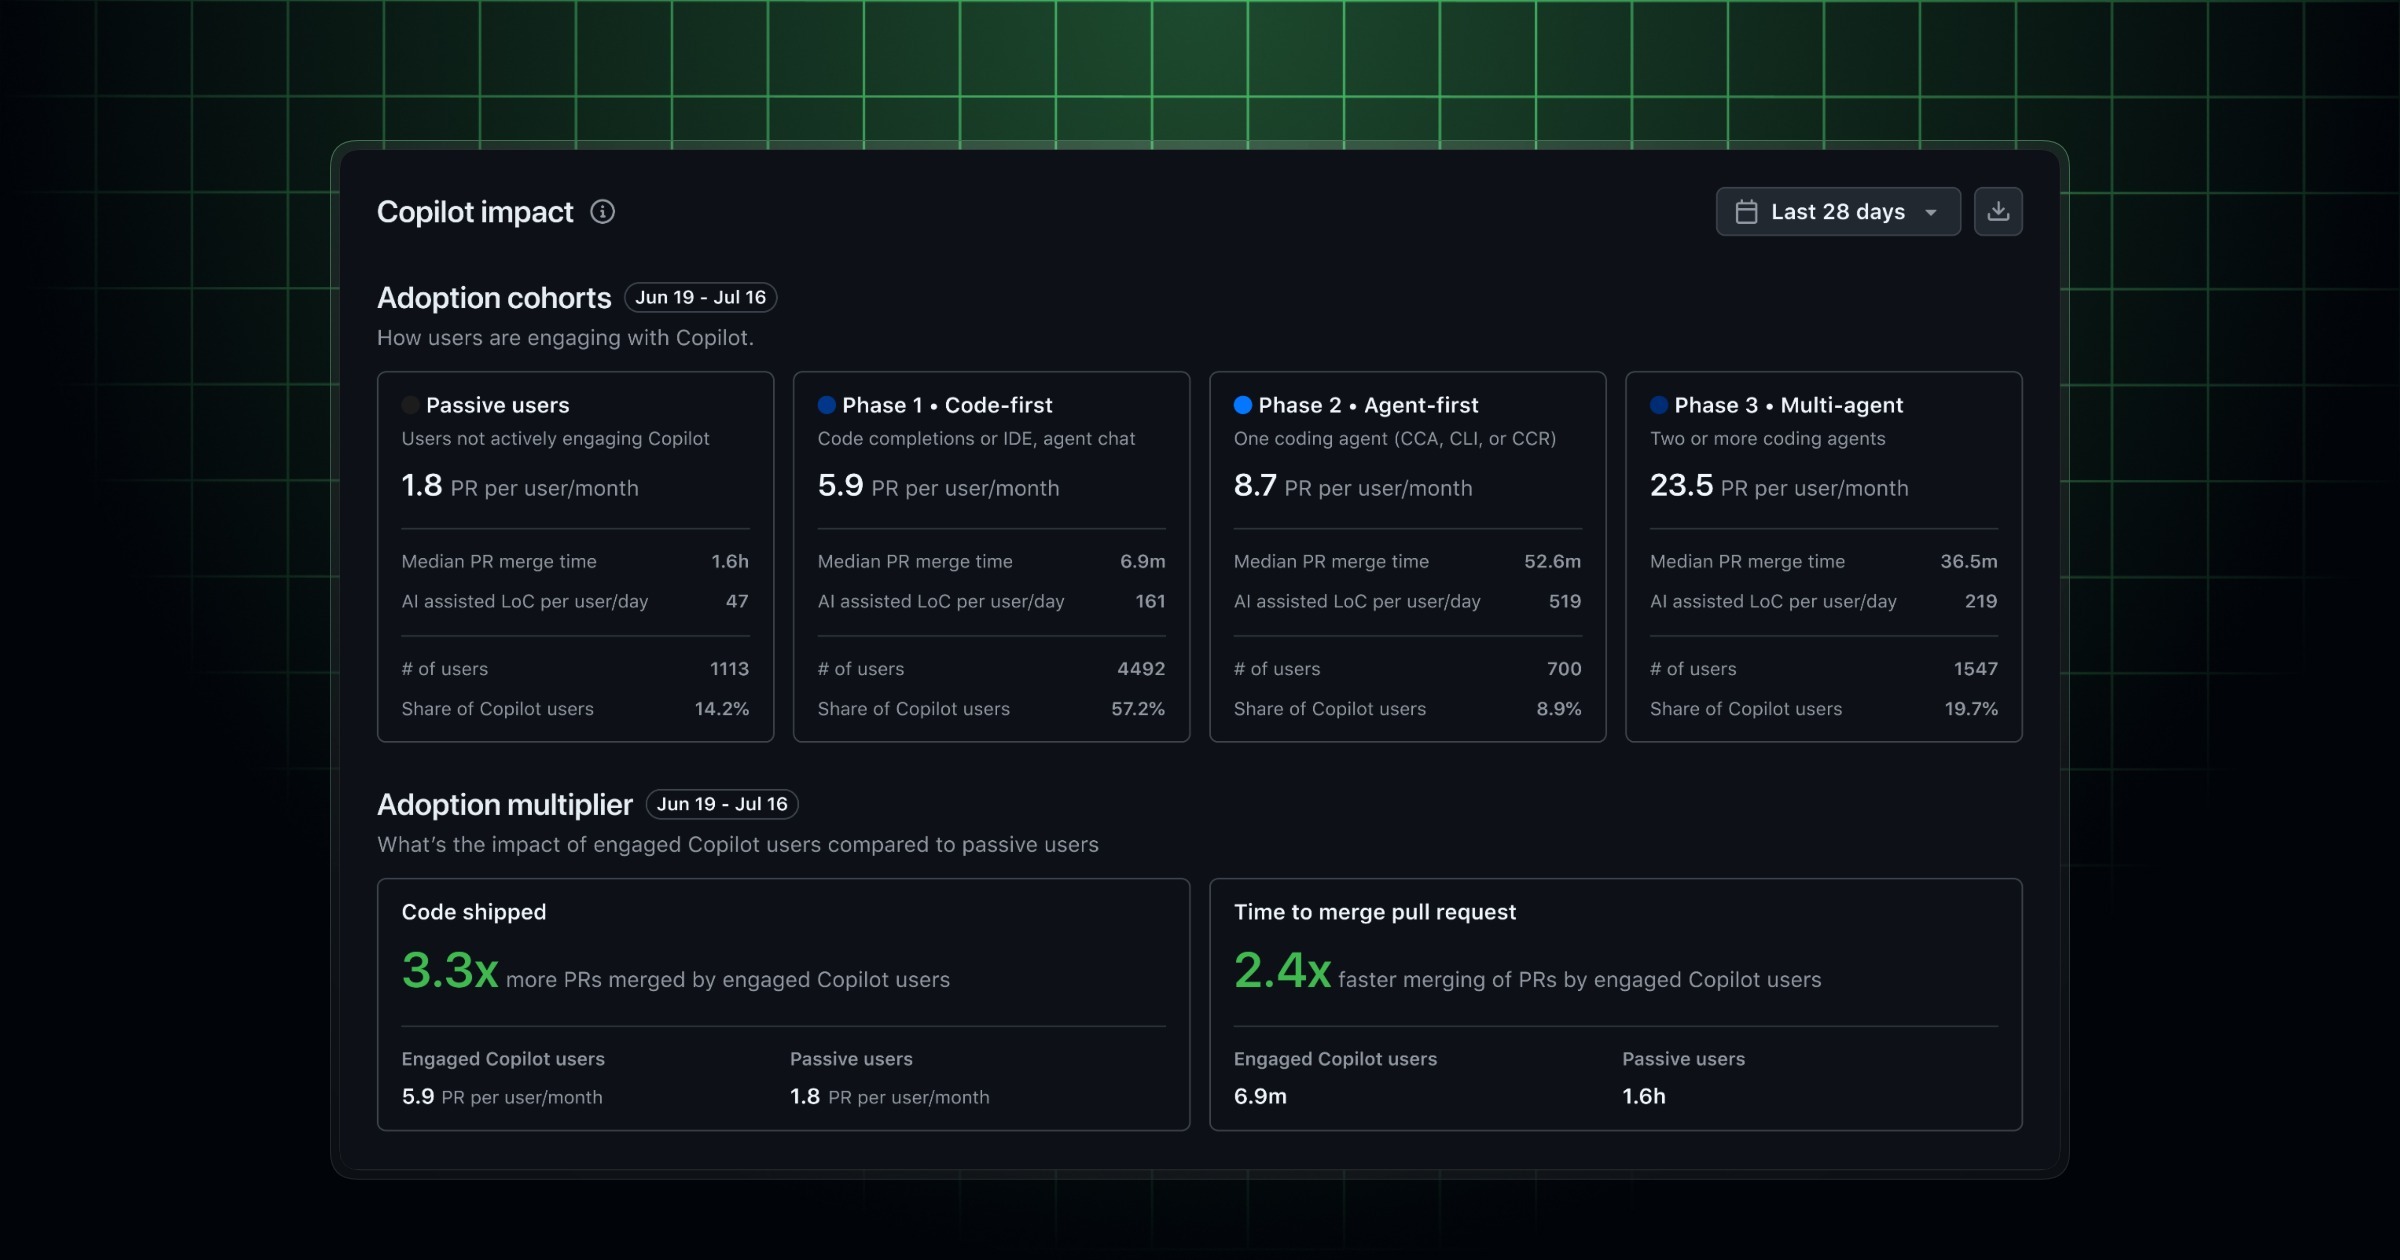
GitHub has released a new Copilot metrics impact dashboard. This dashboard is designed for enterprise administrators and organization owners. It provides insights into how users are engaging with Copilot, moving beyond simple active-user counts.
Key Points
- The dashboard groups engaged users by AI adoption phase.
- It includes per-cohort cards for Phase 1 (Code-first), Phase 2 (Agent-first), and Phase 3 (Multi-agent or Copilot app), along with a Passive segment.
- Metrics displayed for each phase include average pull requests merged per user per month and median pull request merge velocity.
- An Adoption multiplier compares throughput and speed between passive users and engaged Copilot users.
- Trends charts show cohort growth and pull request throughput over a six-month period.
- The dashboard provides recommended next steps for administrators to deepen user adoption.
- Cohort assignments are based on the
ai_adoption_phaseclassification from the Copilot usage metrics API, using a rolling 28-day window of product usage.
Context
According to GitHub, the dashboard builds on the AI adoption phase cohorts available in the Copilot usage metrics API. It transforms per-phase data into a visual representation of adoption depth, impact, and actions to guide developers into deeper-adoption cohorts. The dashboard is accessible to enterprise administrators and organization owners with access to Copilot usage metrics.
Why It Matters
This dashboard allows administrators to understand the actual adoption of Copilot capabilities by developers. It helps identify licensed but unengaged users and provides actionable guidance to increase engagement and move users into more advanced adoption phases.
What To Do
- Open the new Copilot metrics impact dashboard if you are an enterprise administrator or organization owner.
- Review the per-cohort cards to understand user distribution across AI adoption phases.
- Examine the Adoption multiplier to compare productivity between passive and engaged Copilot users.
- Note the recommended next steps to target enablement efforts for users in earlier adoption phases.
Keep Exploring
/atlas/gpt-family