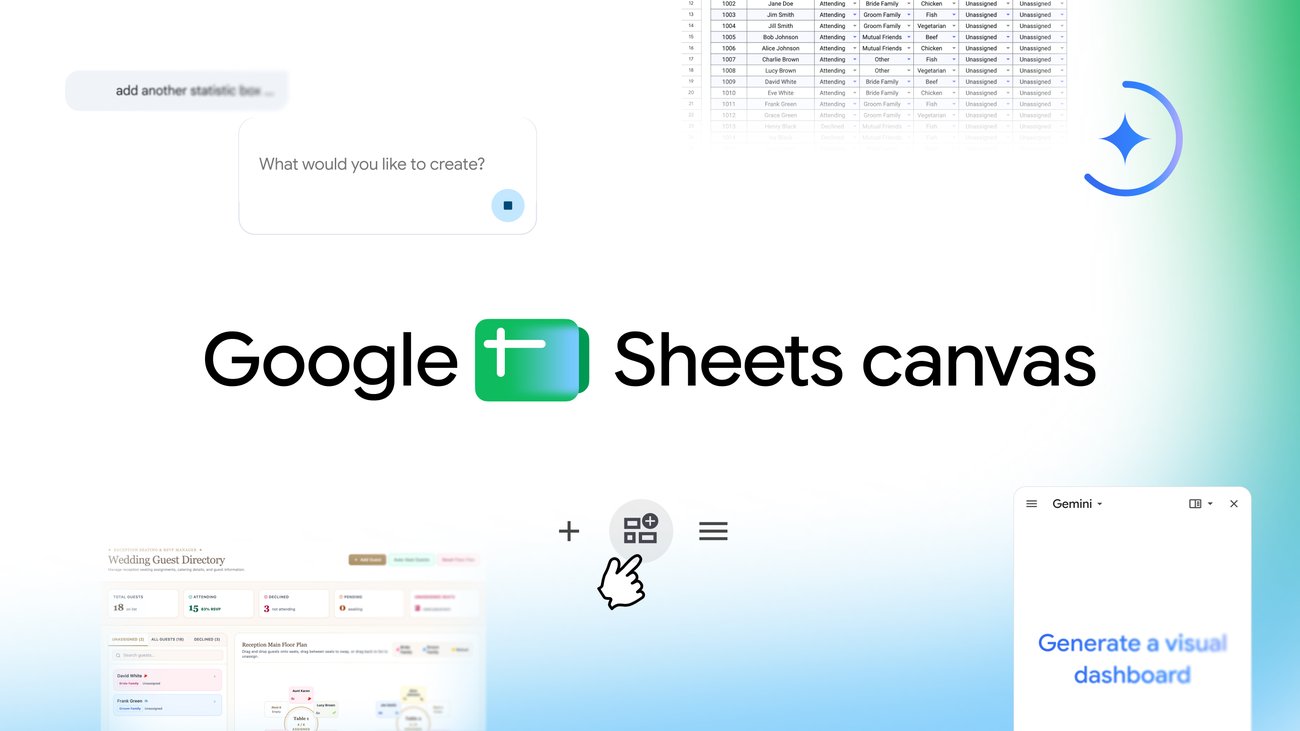
Google AI Blog announced Sheets canvas, a new feature designed to transform data within Google Sheets. This tool enables the creation of various interactive elements, including dashboards, custom study trackers, and seating charts.
Key Points
- Sheets canvas converts data into interactive dashboards.
- Users can generate custom study trackers with Sheets canvas.
- Seating charts can be created using Sheets canvas.
- The creation process relies on a simple prompt.
Context
According to the Google AI Blog, Sheets canvas is designed to bring data to life within spreadsheets. It offers a method for users to visualize and interact with their data in new formats.
Why It Matters
This feature provides Google Sheets users with a new capability to transform raw data into more engaging and functional visual tools, potentially streamlining data presentation and analysis workflows.
What To Do
- Note the types of interactive elements that can be generated, such as dashboards and trackers.
- Consider how simple prompts can be used to initiate these transformations.
- Watch for further details on how to access and utilize Sheets canvas within Google Sheets.